
Preseason Bracketology: Our First 2022 NCAA Tournament Bracket Prediction
Here are our predictions for which teams will make the 2022 NCAA tournament as we get ready for the start of the 2021-22 college basketball season.
November 8, 2021 – by Jason Lisk
It’s college basketball season eve!
Last week, we released our preseason rankings and ratings, along with our preseason predictions for each conference. Here, we’ll provide our bracketology predictions for how the 2022 NCAA tournament will shape up, right before the season begins.
How Did We Do With Last Year’s Preseason Bracketology?
Let’s first recap how last year’s preseason bracketology predictions did compared to the actual 2021 NCAA tournament field.
Two of four top seeds likely correct. Our projected No. 1 seeds last year were Gonzaga, Kansas, Baylor, and Villanova. Gonzaga and Baylor were the top two teams in the nation for most of the year, and they ended up in the championship game. Kansas was a No. 3 seed. Villanova likely would have been a No. 2 or No. 3 seed, but PG Collin Gillespie suffered a season-ending injury late in the year, dropping the Wildcats to a No. 5 seed.Twenty of 22 conferences correctly projected as one-bid. The only conferences we incorrectly projected as a one-bid league were the Mountain West, where Utah State got into the field, and the Missouri Valley, where Drake was selected as an at-large into the First Four. We had a member of both conferences in our first five out in the preseason (Northern Iowa from the MVC, and Utah State from the Mountain West).Seven of 20 one-bid conference champs correct. Based on our preseason conference tournament win odds, we expected to get an average of 7.3 correct from those 20 conferences. Seven is right in line with our expectations.Thirty-six of 48 at-large quality teams correct. We projected 48 teams above the at-large cutoff line (37 at larges, and 11 projected conference champs). Thirty-six of them made into the 2021 NCAA tournament field. One of the misses self-imposed a postseason ban (Arizona) after the start of the season and would have been right on the bubble. Another, Oklahoma State, was banned from the postseason at the start of the year when we released the bracket projections. However, it appealed and was allowed to participate.One projected top-four seed missed the tournament. Duke was the only team projected to be on a top-four seed line that wound up missing the NCAA tournament. Based on our preseason estimates, we would have expected 2.4 teams projected in the top four seeds to miss the tournament. This was a chalkier year where the expected top teams were among the best, outside of Duke.One actual top-four seed wasn’t in our preseason bracket: The only “miss” was not foreseeing that Oklahoma State would be allowed in the NCAA tournament. Every other top-four seed was in our projected preseason bracket. Outside of Oklahoma State, the highest-seeded team that wasn’t in our preseason field was USC, a No. 6 seed that surged with lots of young talent.The ACC was the biggest disappointment. The biggest conference disappointment was the ACC, and that was reflected in our projection misses. In addition to Duke, we also had Miami, Louisville and NC State in the tournament, so ACC teams accounted for one-third of our misses.
We weren’t perfect, but we didn’t expect to be. Again, we made these NCAA tournament predictions before the first game of the 2020-21 season.
In the end, teams in our preseason bracket reached the tournament slightly more often than we expected. Our projections were also better for the at-large quality teams than for the automatic bids.
Overall, we think we did pretty well for November!
Now, on to our 2022 NCAA tournament projected bracket.
Preseason Projected No. 1 NCAA Seeds in 2021-22
Here are our projected No. 1 seeds in the 2021 NCAA tournament:
Gonzaga (67% chance)Michigan (31% chance)Purdue (22% chance)Kansas (21% chance)
Now, on to the rest of the bracket…
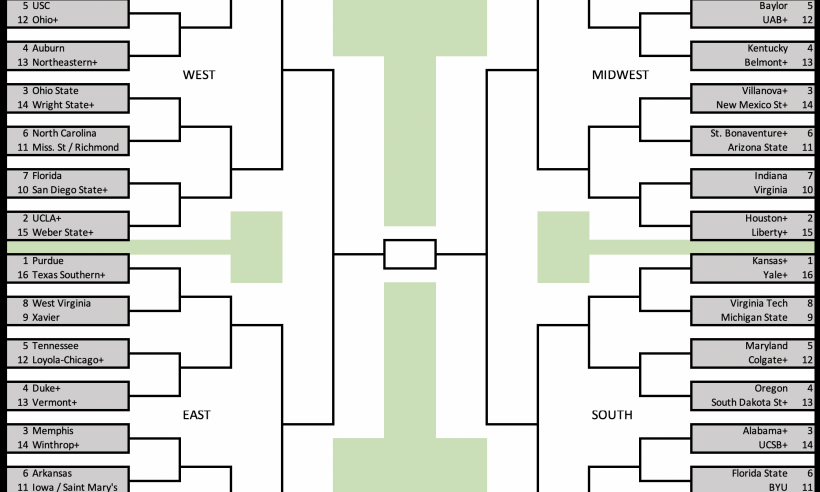
2021-22 Projected NCAA Tournament Bracket (Preseason Edition)
Here is a bracket putting each of the teams into a specific matchup. If you just want to see the projected seeds, you can go down to the table at the bottom of this post.

For details on how this bracket was created, see our original Madness Strikes November blog post. That post goes into more detail, but the basic idea is:
Simulate the regular seasonSeed and play out the conference tournamentsSimulate the NCAA tournament selection and seeding process
2021-22 NCAA Bid Odds for All 358 Teams
Our NCAA selection and seeding model doesn’t directly produce the projected bracket you see above. Its output is a set of odds describing each team’s chance to make the NCAA tournament and to earn each specific seed (among other info).
The bracket is created at the end based on those odds. However, we also use a bit of manual intervention to assign teams to specific bracket lines.
What does that mean for you? It means you get to see lots of juicy data, if you so desire.
Below, you’ll find our official 2022 NCAA tournament preseason projected bracketology odds for every team. Other pages on our site will be updating various odds on a daily basis as each day’s game results come in:
For a sortable table of similar odds that we update daily, check out our NCAA Bracketology detail page.To go a step further and see projected round-by-round NCAA tournament advancement odds based on our simulated brackets, check out our NCAA Tournament Bracket Predictions.
Some Final Tips for Understanding Our Bracketology Odds
In the 358-row table below, you might notice that some power conferences have more teams projected in the field than others. For example, the SEC has eight teams in the projected field, while the American Conference only has two.
Does that mean we expect the SEC to get eight teams in the tournament and the American to get only two? No. But when projecting individual teams, several SEC teams have percentage chances just above the cutline, while some of the American bubble teams are just below it.
For comparison, here is the number of teams appearing in the at-large bid range (37 at-larges plus nine auto bids) versus the number of teams we expect from each conference when we add up each individual team’s chances of making the tournament:
| Conference | Preseason Field | Expected |
|---|---|---|
| Big Ten | 9 | 8.3 |
| SEC | 8 | 6.4 |
| ACC | 6 | 6.4 |
| Big 12 | 6 | 5.0 |
| Pac 12 | 5 | 5.3 |
| Big East | 4 | 4.5 |
| West Coast | 3 | 2.5 |
| American | 2 | 3.1 |
| Atlantic 10 | 2 | 2.4 |
| Mountain West | 1 | 1.9 |
| TOTAL | 46 | 45.8 |
So if you ask us how many teams will make the tournament from the SEC and the American, we would say about six and three, respectively.
But if you asked us to project the specific field by individual teams with the best chances, we would have a few more SEC teams and a fewer American teams. That’s because nailing the identity of the specific American teams is more unlikely outside of Houston and Memphis.
Without Further Ado…
Here are our 2021-22 preseason bracketology odds for every team:
| TR Bracket Seed | Team | Bid | Auto | At Large | Avg Seed If In | 1-4 Seed | 1 Seed |
|---|---|---|---|---|---|---|---|
| 1 | Gonzaga | 97% | 69% | 28% | 1.7 | 92% | 67% |
| 1 | Michigan | 98% | 22% | 76% | 3.6 | 69% | 31% |
| 1 | Purdue | 94% | 18% | 77% | 4.1 | 60% | 22% |
| 1 | Kansas | 96% | 24% | 72% | 4.3 | 59% | 21% |
| 2 | UCLA | 92% | 33% | 59% | 3.9 | 61% | 19% |
| 2 | Illinois | 93% | 15% | 78% | 4.5 | 54% | 17% |
| 2 | Texas | 80% | 25% | 55% | 3.9 | 51% | 15% |
| 2 | Houston | 85% | 34% | 51% | 4.4 | 49% | 11% |
| 3 | Ohio State | 92% | 12% | 79% | 5.2 | 45% | 13% |
| 3 | Alabama | 95% | 16% | 79% | 5.6 | 43% | 12% |
| 3 | Villanova | 91% | 27% | 64% | 5.2 | 44% | 10% |
| 3 | Memphis | 87% | 30% | 56% | 4.8 | 46% | 10% |
| 4 | Auburn | 86% | 14% | 71% | 5.5 | 38% | 9% |
| 4 | Kentucky | 85% | 16% | 69% | 5.4 | 38% | 9% |
| 4 | Oregon | 84% | 18% | 66% | 5.4 | 37% | 9% |
| 4 | Duke | 80% | 20% | 61% | 5.3 | 36% | 7% |
| 5 | Baylor | 79% | 17% | 62% | 5.3 | 36% | 9% |
| 5 | Tennessee | 86% | 15% | 71% | 5.8 | 35% | 8% |
| 5 | Maryland | 84% | 9% | 76% | 5.9 | 32% | 7% |
| 5 | USC | 80% | 18% | 62% | 5.5 | 35% | 7% |
| 6 | Arkansas | 72% | 15% | 58% | 4.8 | 37% | 7% |
| 6 | Florida St | 81% | 14% | 67% | 6.4 | 27% | 5% |
| 6 | St Bonavent | 80% | 39% | 41% | 5.8 | 32% | 5% |
| 6 | N Carolina | 78% | 14% | 65% | 6.4 | 26% | 5% |
| 7 | Florida | 73% | 11% | 62% | 5.9 | 27% | 5% |
| 7 | Indiana | 72% | 7% | 65% | 6.0 | 27% | 5% |
| 7 | Texas Tech | 66% | 14% | 52% | 5.4 | 28% | 5% |
| 7 | Louisville | 78% | 13% | 65% | 6.7 | 23% | 4% |
| 8 | Seton Hall | 70% | 15% | 55% | 6.5 | 22% | 4% |
| 8 | Connecticut | 65% | 18% | 47% | 5.7 | 26% | 4% |
| 8 | W Virginia | 76% | 9% | 67% | 7.1 | 20% | 3% |
| 8 | VA Tech | 73% | 11% | 62% | 6.9 | 20% | 3% |
| 9 | Michigan St | 73% | 5% | 68% | 7.0 | 19% | 3% |
| 9 | Oklahoma | 70% | 9% | 61% | 6.9 | 19% | 3% |
| 9 | Arizona | 69% | 12% | 58% | 6.7 | 20% | 3% |
| 9 | Xavier | 66% | 13% | 53% | 6.9 | 18% | 2% |
| 10 | Virginia | 64% | 11% | 54% | 6.8 | 18% | 2% |
| 10 | LSU | 60% | 5% | 55% | 8.0 | 11% | 1% |
| 10 | Penn State | 55% | 4% | 51% | 7.3 | 12% | 1% |
| 10 | San Diego St | 52% | 25% | 27% | 7.1 | 13% | 1% |
| 11 | St Marys | 56% | 8% | 48% | 8.2 | 8% | 1% |
| 11 | BYU | 53% | 10% | 43% | 7.2 | 12% | 1% |
| 11 | Arizona St | 53% | 5% | 49% | 8.8 | 6% | 1% |
| 11 | Iowa | 50% | 4% | 46% | 7.1 | 11% | 1% |
| 11 | Richmond | 51% | 16% | 35% | 8.6 | 7% | 0% |
| 11 | Miss State | 43% | 3% | 40% | 8.7 | 5% | 0% |
| 12 | Colgate | 73% | 73% | 0% | 11.6 | 1% | 0% |
| 12 | UAB | 38% | 38% | 0% | 8.9 | 4% | 0% |
| 12 | Loyola-Chi | 37% | 34% | 2% | 8.4 | 6% | 0% |
| 12 | Ohio | 26% | 26% | 0% | 11.0 | 1% | 0% |
| 13 | Vermont | 52% | 52% | 0% | 13.2 | 0% | 0% |
| 13 | Belmont | 45% | 45% | 0% | 12.9 | 0% | 0% |
| 13 | S Dakota St | 45% | 45% | 0% | 13.2 | 0% | 0% |
| 13 | Northeastrn | 37% | 36% | 1% | 12.6 | 0% | 0% |
| 14 | Winthrop | 50% | 50% | 0% | 14.2 | 0% | 0% |
| 14 | Wright State | 36% | 36% | 0% | 13.2 | 0% | 0% |
| 14 | N Mex State | 35% | 35% | 0% | 12.7 | 0% | 0% |
| 14 | UCSB | 33% | 33% | 0% | 13.0 | 0% | 0% |
| 15 | Liberty | 35% | 35% | 0% | 13.5 | 0% | 0% |
| 15 | Iona | 32% | 32% | 0% | 13.7 | 0% | 0% |
| 15 | Furman | 30% | 30% | 0% | 12.4 | 0% | 0% |
| 15 | Weber State | 30% | 30% | 0% | 13.0 | 0% | 0% |
| 16 | Nicholls St | 53% | 53% | 0% | 15.5 | 0% | 0% |
| 16 | TX Southern | 39% | 39% | 0% | 15.1 | 0% | 0% |
| 16 | Morgan St | 38% | 38% | 0% | 15.8 | 0% | 0% |
| 16 | Yale | 30% | 30% | 0% | 14.0 | 0% | 0% |
| 16 | Bryant | 28% | 28% | 0% | 15.1 | 0% | 0% |
| 16 | Georgia St | 26% | 26% | 0% | 13.2 | 0% | 0% |
| Nevada | 43% | 21% | 22% | 7.2 | 10% | 1% | |
| Notre Dame | 43% | 6% | 37% | 7.6 | 8% | 1% | |
| S Methodist | 39% | 12% | 27% | 6.4 | 11% | 1% | |
| Wisconsin | 39% | 1% | 37% | 8.8 | 4% | 0% | |
| NC State | 38% | 3% | 36% | 9.2 | 3% | 0% | |
| Colorado | 37% | 5% | 32% | 8.0 | 5% | 0% | |
| Wichita St | 36% | 7% | 29% | 8.0 | 5% | 0% | |
| VCU | 35% | 12% | 24% | 9.0 | 3% | 0% | |
| Murray St | 35% | 35% | 0% | 13.5 | 0% | 0% | |
| Butler | 33% | 6% | 28% | 8.1 | 5% | 0% | |
| St Johns | 32% | 8% | 24% | 6.9 | 7% | 1% | |
| UC Irvine | 32% | 32% | 0% | 12.7 | 0% | 0% | |
| Wash State | 31% | 3% | 28% | 8.6 | 3% | 0% | |
| Rutgers | 31% | 1% | 29% | 8.8 | 3% | 0% | |
| Central FL | 30% | 7% | 23% | 8.1 | 4% | 0% | |
| Providence | 30% | 4% | 26% | 8.6 | 3% | 0% | |
| San Fransco | 28% | 8% | 20% | 6.9 | 7% | 0% | |
| Utah State | 28% | 15% | 12% | 8.0 | 4% | 0% | |
| Boise State | 28% | 12% | 16% | 8.6 | 3% | 0% | |
| Clemson | 28% | 3% | 26% | 8.7 | 3% | 0% | |
| Marquette | 27% | 4% | 23% | 9.0 | 2% | 0% | |
| Drake | 26% | 26% | 0% | 9.4 | 2% | 0% | |
| Syracuse | 26% | 2% | 24% | 9.5 | 2% | 0% | |
| Stanford | 26% | 2% | 24% | 9.6 | 1% | 0% | |
| TX Christian | 25% | 2% | 23% | 9.6 | 2% | 0% | |
| Buffalo | 25% | 25% | 0% | 10.9 | 1% | 0% | |
| Harvard | 25% | 25% | 0% | 14.9 | 0% | 0% | |
| Cincinnati | 24% | 7% | 17% | 7.6 | 4% | 0% | |
| Colorado St | 24% | 16% | 8% | 7.9 | 4% | 0% | |
| Oregon St | 23% | 2% | 21% | 9.5 | 1% | 0% | |
| Princeton | 23% | 23% | 0% | 14.4 | 0% | 0% | |
| Prairie View | 23% | 23% | 0% | 15.6 | 0% | 0% | |
| Davidson | 22% | 7% | 15% | 9.9 | 1% | 0% | |
| Jksnville St | 22% | 22% | 0% | 13.8 | 0% | 0% | |
| Creighton | 21% | 4% | 17% | 8.4 | 2% | 0% | |
| Nebraska | 21% | 1% | 20% | 9.8 | 1% | 0% | |
| N Dakota St | 21% | 21% | 0% | 14.4 | 0% | 0% | |
| Northwestern | 20% | 1% | 18% | 8.0 | 3% | 0% | |
| Miami (FL) | 20% | 1% | 18% | 9.6 | 1% | 0% | |
| Norfolk St | 20% | 20% | 0% | 16.0 | 0% | 0% | |
| Washington | 19% | 1% | 18% | 10.4 | 1% | 0% | |
| S Utah | 19% | 19% | 0% | 13.7 | 0% | 0% | |
| E Tenn St | 18% | 18% | 0% | 13.3 | 0% | 0% | |
| NC-Grnsboro | 18% | 18% | 0% | 13.4 | 0% | 0% | |
| Cleveland St | 18% | 18% | 0% | 14.1 | 0% | 0% | |
| Mississippi | 17% | 3% | 15% | 7.0 | 4% | 0% | |
| Merrimack | 17% | 17% | 0% | 15.4 | 0% | 0% | |
| GA Tech | 16% | 2% | 14% | 8.2 | 2% | 0% | |
| Loyola Mymt | 16% | 3% | 13% | 8.8 | 1% | 0% | |
| Missouri St | 16% | 16% | 1% | 10.3 | 1% | 0% | |
| N Iowa | 16% | 12% | 5% | 10.5 | 1% | 0% | |
| Grd Canyon | 16% | 16% | 0% | 13.8 | 0% | 0% | |
| James Mad | 16% | 16% | 0% | 14.1 | 0% | 0% | |
| St Peters | 16% | 16% | 0% | 14.6 | 0% | 0% | |
| Wagner | 16% | 16% | 0% | 15.3 | 0% | 0% | |
| Rhode Island | 15% | 7% | 9% | 9.8 | 1% | 0% | |
| Saint Louis | 15% | 6% | 10% | 10.2 | 1% | 0% | |
| Fla Gulf Cst | 15% | 15% | 0% | 14.2 | 0% | 0% | |
| N Kentucky | 15% | 15% | 0% | 14.3 | 0% | 0% | |
| Stony Brook | 15% | 15% | 0% | 14.6 | 0% | 0% | |
| New Orleans | 15% | 15% | 0% | 16.0 | 0% | 0% | |
| Utah | 14% | 2% | 13% | 9.2 | 1% | 0% | |
| LA Tech | 14% | 13% | 1% | 10.9 | 0% | 0% | |
| Toledo | 14% | 14% | 0% | 12.0 | 0% | 0% | |
| Coastal Car | 14% | 14% | 0% | 13.9 | 0% | 0% | |
| Portland St | 14% | 14% | 0% | 14.0 | 0% | 0% | |
| UC Riverside | 14% | 14% | 0% | 14.0 | 0% | 0% | |
| Montana | 14% | 14% | 0% | 14.1 | 0% | 0% | |
| Oral Roberts | 14% | 14% | 0% | 14.7 | 0% | 0% | |
| Jackson St | 14% | 14% | 0% | 15.8 | 0% | 0% | |
| Coppin State | 14% | 14% | 0% | 16.0 | 0% | 0% | |
| Howard | 14% | 14% | 0% | 16.0 | 0% | 0% | |
| W Kentucky | 13% | 13% | 0% | 11.4 | 0% | 0% | |
| E Kentucky | 13% | 13% | 0% | 14.2 | 0% | 0% | |
| Morehead St | 13% | 13% | 0% | 14.6 | 0% | 0% | |
| Ste F Austin | 12% | 12% | 0% | 13.9 | 0% | 0% | |
| Chattanooga | 12% | 12% | 0% | 13.9 | 0% | 0% | |
| Wofford | 12% | 12% | 0% | 13.9 | 0% | 0% | |
| LA Lafayette | 12% | 12% | 0% | 14.1 | 0% | 0% | |
| Drexel | 12% | 12% | 0% | 14.4 | 0% | 0% | |
| Monmouth | 12% | 12% | 0% | 14.7 | 0% | 0% | |
| U Penn | 12% | 12% | 0% | 14.9 | 0% | 0% | |
| NC Central | 12% | 12% | 0% | 16.0 | 0% | 0% | |
| U Mass | 11% | 5% | 6% | 10.3 | 0% | 0% | |
| Abl Christian | 11% | 11% | 0% | 14.0 | 0% | 0% | |
| Seattle | 11% | 11% | 0% | 14.2 | 0% | 0% | |
| Boston U | 11% | 11% | 0% | 14.3 | 0% | 0% | |
| South Dakota | 11% | 11% | 0% | 14.9 | 0% | 0% | |
| Campbell | 11% | 11% | 0% | 15.4 | 0% | 0% | |
| Mt St Marys | 11% | 11% | 0% | 15.5 | 0% | 0% | |
| McNeese St | 11% | 11% | 0% | 16.0 | 0% | 0% | |
| Akron | 10% | 10% | 0% | 12.9 | 0% | 0% | |
| App State | 10% | 10% | 0% | 14.3 | 0% | 0% | |
| N Colorado | 10% | 10% | 0% | 14.4 | 0% | 0% | |
| Hofstra | 10% | 9% | 0% | 14.5 | 0% | 0% | |
| Hartford | 10% | 10% | 0% | 14.8 | 0% | 0% | |
| Marist | 10% | 10% | 0% | 15.0 | 0% | 0% | |
| Radford | 10% | 10% | 0% | 15.3 | 0% | 0% | |
| LIU | 10% | 10% | 0% | 15.6 | 0% | 0% | |
| Tulsa | 9% | 2% | 7% | 9.2 | 1% | 0% | |
| Dayton | 9% | 6% | 4% | 10.0 | 0% | 0% | |
| Marshall | 9% | 8% | 0% | 11.6 | 0% | 0% | |
| UNLV | 9% | 7% | 2% | 12.0 | 0% | 0% | |
| Bowling Grn | 9% | 9% | 0% | 13.0 | 0% | 0% | |
| Utah Val St | 9% | 9% | 0% | 14.1 | 0% | 0% | |
| Arkansas St | 9% | 9% | 0% | 14.5 | 0% | 0% | |
| Gard-Webb | 9% | 9% | 0% | 15.4 | 0% | 0% | |
| DePaul | 8% | 1% | 7% | 10.4 | 0% | 0% | |
| Kansas St | 8% | 1% | 8% | 10.7 | 0% | 0% | |
| Navy | 8% | 8% | 0% | 14.4 | 0% | 0% | |
| Longwood | 8% | 8% | 0% | 15.5 | 0% | 0% | |
| St Fran (PA) | 8% | 8% | 0% | 15.7 | 0% | 0% | |
| SE Louisiana | 8% | 8% | 0% | 16.0 | 0% | 0% | |
| Vanderbilt | 7% | 1% | 7% | 9.4 | 0% | 0% | |
| Georgetown | 7% | 1% | 6% | 10.0 | 0% | 0% | |
| Minnesota | 7% | 0% | 7% | 10.3 | 0% | 0% | |
| North Texas | 7% | 6% | 2% | 11.8 | 0% | 0% | |
| Kent State | 7% | 7% | 0% | 13.0 | 0% | 0% | |
| Lipscomb | 7% | 7% | 0% | 14.6 | 0% | 0% | |
| TX-Arlington | 7% | 7% | 0% | 14.6 | 0% | 0% | |
| Towson | 7% | 7% | 0% | 14.7 | 0% | 0% | |
| IPFW | 7% | 7% | 0% | 14.8 | 0% | 0% | |
| Delaware | 7% | 7% | 0% | 14.8 | 0% | 0% | |
| Grambling St | 7% | 7% | 0% | 15.9 | 0% | 0% | |
| Southern | 7% | 7% | 0% | 15.9 | 0% | 0% | |
| Texas A&M | 6% | 1% | 5% | 7.8 | 1% | 0% | |
| Pittsburgh | 6% | 0% | 5% | 10.3 | 0% | 0% | |
| Old Dominion | 6% | 6% | 0% | 12.3 | 0% | 0% | |
| Mercer | 6% | 6% | 0% | 14.4 | 0% | 0% | |
| Sam Hous St | 6% | 6% | 0% | 14.4 | 0% | 0% | |
| Hawaii | 6% | 6% | 0% | 14.6 | 0% | 0% | |
| Texas State | 6% | 6% | 0% | 14.7 | 0% | 0% | |
| S Alabama | 6% | 6% | 0% | 14.7 | 0% | 0% | |
| IL-Chicago | 6% | 6% | 0% | 14.8 | 0% | 0% | |
| Albany | 6% | 6% | 0% | 15.2 | 0% | 0% | |
| UMKC | 6% | 6% | 0% | 15.4 | 0% | 0% | |
| Sacred Hrt | 6% | 6% | 0% | 15.7 | 0% | 0% | |
| Missouri | 5% | 0% | 5% | 10.5 | 0% | 0% | |
| S Illinois | 5% | 5% | 0% | 12.5 | 0% | 0% | |
| Charlotte | 5% | 4% | 0% | 12.8 | 0% | 0% | |
| Miami (OH) | 5% | 5% | 0% | 13.7 | 0% | 0% | |
| CS Bakersfld | 5% | 5% | 0% | 14.8 | 0% | 0% | |
| Maryland BC | 5% | 5% | 0% | 15.2 | 0% | 0% | |
| Niagara | 5% | 5% | 0% | 15.3 | 0% | 0% | |
| Fairfield | 5% | 5% | 0% | 15.3 | 0% | 0% | |
| Rider | 5% | 5% | 0% | 15.4 | 0% | 0% | |
| NC-Asheville | 5% | 5% | 0% | 15.6 | 0% | 0% | |
| Florida A&M | 5% | 5% | 0% | 15.9 | 0% | 0% | |
| California | 4% | 0% | 4% | 10.6 | 0% | 0% | |
| Fla Atlantic | 4% | 4% | 0% | 13.1 | 0% | 0% | |
| Ball State | 4% | 4% | 0% | 13.9 | 0% | 0% | |
| UC Davis | 4% | 4% | 0% | 14.9 | 0% | 0% | |
| E Washingtn | 4% | 4% | 0% | 14.9 | 0% | 0% | |
| Detroit | 4% | 4% | 0% | 15.0 | 0% | 0% | |
| Oakland | 4% | 4% | 0% | 15.0 | 0% | 0% | |
| Idaho State | 4% | 4% | 0% | 15.0 | 0% | 0% | |
| Col Charlestn | 4% | 4% | 0% | 15.1 | 0% | 0% | |
| NC-Wilmgton | 4% | 4% | 0% | 15.1 | 0% | 0% | |
| Montana St | 4% | 4% | 0% | 15.2 | 0% | 0% | |
| Siena | 4% | 4% | 0% | 15.3 | 0% | 0% | |
| Mass Lowell | 4% | 4% | 0% | 15.3 | 0% | 0% | |
| N Hampshire | 4% | 4% | 0% | 15.3 | 0% | 0% | |
| Canisius | 4% | 4% | 0% | 15.4 | 0% | 0% | |
| Brown | 4% | 4% | 0% | 15.4 | 0% | 0% | |
| Quinnipiac | 4% | 4% | 0% | 15.5 | 0% | 0% | |
| NW State | 4% | 4% | 0% | 16.0 | 0% | 0% | |
| TX A&M-CC | 4% | 4% | 0% | 16.0 | 0% | 0% | |
| Wake Forest | 3% | 1% | 2% | 8.8 | 0% | 0% | |
| S Carolina | 3% | 0% | 3% | 9.9 | 0% | 0% | |
| Stetson | 3% | 3% | 0% | 14.9 | 0% | 0% | |
| WI-Milwkee | 3% | 3% | 0% | 15.0 | 0% | 0% | |
| LA Monroe | 3% | 3% | 0% | 15.0 | 0% | 0% | |
| GA Southern | 3% | 3% | 0% | 15.0 | 0% | 0% | |
| CS Fullerton | 3% | 3% | 0% | 15.1 | 0% | 0% | |
| Rob Morris | 3% | 3% | 0% | 15.2 | 0% | 0% | |
| Dartmouth | 3% | 3% | 0% | 15.5 | 0% | 0% | |
| Cornell | 3% | 3% | 0% | 15.6 | 0% | 0% | |
| Manhattan | 3% | 3% | 0% | 15.6 | 0% | 0% | |
| W Illinois | 3% | 3% | 0% | 15.7 | 0% | 0% | |
| NC A&T | 3% | 3% | 0% | 15.8 | 0% | 0% | |
| St Fran (NY) | 3% | 3% | 0% | 15.8 | 0% | 0% | |
| Incar Word | 3% | 3% | 0% | 16.0 | 0% | 0% | |
| Alcorn State | 3% | 3% | 0% | 16.0 | 0% | 0% | |
| Duquesne | 2% | 1% | 1% | 11.9 | 0% | 0% | |
| Fresno St | 2% | 2% | 0% | 12.2 | 0% | 0% | |
| Wyoming | 2% | 2% | 0% | 12.7 | 0% | 0% | |
| Bradley | 2% | 2% | 0% | 13.4 | 0% | 0% | |
| Indiana St | 2% | 2% | 0% | 13.4 | 0% | 0% | |
| S Mississippi | 2% | 2% | 0% | 13.4 | 0% | 0% | |
| Rice | 2% | 2% | 0% | 13.5 | 0% | 0% | |
| TX El Paso | 2% | 2% | 0% | 13.5 | 0% | 0% | |
| VA Military | 2% | 2% | 0% | 15.1 | 0% | 0% | |
| Jacksonville | 2% | 2% | 0% | 15.2 | 0% | 0% | |
| Troy | 2% | 2% | 0% | 15.2 | 0% | 0% | |
| Elon | 2% | 2% | 0% | 15.3 | 0% | 0% | |
| American | 2% | 2% | 0% | 15.3 | 0% | 0% | |
| Kennesaw St | 2% | 2% | 0% | 15.3 | 0% | 0% | |
| Citadel | 2% | 2% | 0% | 15.3 | 0% | 0% | |
| Youngs St | 2% | 2% | 0% | 15.4 | 0% | 0% | |
| NJIT | 2% | 2% | 0% | 15.5 | 0% | 0% | |
| Binghamton | 2% | 2% | 0% | 15.5 | 0% | 0% | |
| TN State | 2% | 2% | 0% | 15.6 | 0% | 0% | |
| Austin Peay | 2% | 2% | 0% | 15.6 | 0% | 0% | |
| Hampton | 2% | 2% | 0% | 15.8 | 0% | 0% | |
| High Point | 2% | 2% | 0% | 15.8 | 0% | 0% | |
| F Dickinson | 2% | 2% | 0% | 15.9 | 0% | 0% | |
| Houston Bap | 2% | 2% | 0% | 16.0 | 0% | 0% | |
| Iowa State | 1% | 0% | 1% | 10.0 | 0% | 0% | |
| Santa Clara | 1% | 0% | 1% | 10.4 | 0% | 0% | |
| Boston Col | 1% | 0% | 1% | 10.4 | 0% | 0% | |
| Pacific | 1% | 1% | 0% | 10.4 | 0% | 0% | |
| San Diego | 1% | 0% | 0% | 10.4 | 0% | 0% | |
| Georgia | 1% | 0% | 1% | 10.6 | 0% | 0% | |
| Temple | 1% | 0% | 1% | 11.3 | 0% | 0% | |
| Pepperdine | 1% | 0% | 0% | 11.3 | 0% | 0% | |
| Tulane | 1% | 0% | 1% | 11.4 | 0% | 0% | |
| Geo Mason | 1% | 0% | 0% | 12.3 | 0% | 0% | |
| St Josephs | 1% | 0% | 0% | 12.7 | 0% | 0% | |
| Valparaiso | 1% | 1% | 0% | 13.6 | 0% | 0% | |
| TX-San Ant | 1% | 1% | 0% | 13.8 | 0% | 0% | |
| Illinois St | 1% | 1% | 0% | 14.1 | 0% | 0% | |
| Evansville | 1% | 1% | 0% | 14.1 | 0% | 0% | |
| Central Mich | 1% | 1% | 0% | 15.1 | 0% | 0% | |
| N Florida | 1% | 1% | 0% | 15.3 | 0% | 0% | |
| AR Lit Rock | 1% | 1% | 0% | 15.3 | 0% | 0% | |
| Samford | 1% | 1% | 0% | 15.3 | 0% | 0% | |
| TX-Pan Am | 1% | 1% | 0% | 15.3 | 0% | 0% | |
| Army | 1% | 1% | 0% | 15.4 | 0% | 0% | |
| Loyola-MD | 1% | 1% | 0% | 15.4 | 0% | 0% | |
| Sac State | 1% | 1% | 0% | 15.5 | 0% | 0% | |
| Cal St Nrdge | 1% | 1% | 0% | 15.5 | 0% | 0% | |
| Bucknell | 1% | 1% | 0% | 15.5 | 0% | 0% | |
| Lafayette | 1% | 1% | 0% | 15.5 | 0% | 0% | |
| Holy Cross | 1% | 1% | 0% | 15.5 | 0% | 0% | |
| Lehigh | 1% | 1% | 0% | 15.6 | 0% | 0% | |
| Wm & Mary | 1% | 1% | 0% | 15.6 | 0% | 0% | |
| Cal Poly | 1% | 1% | 0% | 15.6 | 0% | 0% | |
| Idaho | 1% | 1% | 0% | 15.6 | 0% | 0% | |
| TN Tech | 1% | 1% | 0% | 15.7 | 0% | 0% | |
| SE Missouri | 1% | 1% | 0% | 15.7 | 0% | 0% | |
| Lg Beach St | 1% | 1% | 0% | 15.7 | 0% | 0% | |
| Columbia | 1% | 1% | 0% | 15.8 | 0% | 0% | |
| Presbyterian | 1% | 1% | 0% | 15.9 | 0% | 0% | |
| North Dakota | 1% | 1% | 0% | 15.9 | 0% | 0% | |
| Alab A&M | 1% | 1% | 0% | 16.0 | 0% | 0% | |
| S Car State | 1% | 1% | 0% | 16.0 | 0% | 0% | |
| Beth-Cook | 1% | 1% | 0% | 16.0 | 0% | 0% | |
| Maryland ES | 1% | 1% | 0% | 16.0 | 0% | 0% | |
| Delaware St | 1% | 1% | 0% | 16.0 | 0% | 0% | |
| Portland | 0% | 0% | 0% | 12.1 | 0% | 0% | |
| Geo Wshgtn | 0% | 0% | 0% | 12.8 | 0% | 0% | |
| S Florida | 0% | 0% | 0% | 12.8 | 0% | 0% | |
| E Carolina | 0% | 0% | 0% | 12.9 | 0% | 0% | |
| La Salle | 0% | 0% | 0% | 13.1 | 0% | 0% | |
| New Mexico | 0% | 0% | 0% | 14.2 | 0% | 0% | |
| Florida Intl | 0% | 0% | 0% | 14.4 | 0% | 0% | |
| Fordham | 0% | 0% | 0% | 15.0 | 0% | 0% | |
| Middle Tenn | 0% | 0% | 0% | 15.1 | 0% | 0% | |
| Lamar | 0% | 0% | 0% | 15.3 | 0% | 0% | |
| Central Ark | 0% | 0% | 0% | 15.4 | 0% | 0% | |
| W Carolina | 0% | 0% | 0% | 15.5 | 0% | 0% | |
| W Michigan | 0% | 0% | 0% | 15.5 | 0% | 0% | |
| N Illinois | 0% | 0% | 0% | 15.6 | 0% | 0% | |
| E Michigan | 0% | 0% | 0% | 15.7 | 0% | 0% | |
| N Arizona | 0% | 0% | 0% | 15.7 | 0% | 0% | |
| WI-Grn Bay | 0% | 0% | 0% | 15.7 | 0% | 0% | |
| E Illinois | 0% | 0% | 0% | 15.8 | 0% | 0% | |
| Central Conn | 0% | 0% | 0% | 15.9 | 0% | 0% | |
| Maine | 0% | 0% | 0% | 15.9 | 0% | 0% | |
| Neb Omaha | 0% | 0% | 0% | 15.9 | 0% | 0% | |
| TN Martin | 0% | 0% | 0% | 15.9 | 0% | 0% | |
| Air Force | 0% | 0% | 0% | 16.0 | 0% | 0% | |
| Alabama St | 0% | 0% | 0% | 16.0 | 0% | 0% | |
| Ark Pine Bl | 0% | 0% | 0% | 16.0 | 0% | 0% | |
| Charl South | 0% | 0% | 0% | 16.0 | 0% | 0% | |
| Denver | 0% | 0% | 0% | 16.0 | 0% | 0% | |
| IUPUI | 0% | 0% | 0% | 16.0 | 0% | 0% | |
| SC Upstate | 0% | 0% | 0% | 16.0 | 0% | 0% | |
| SIU Edward | 0% | 0% | 0% | 16.0 | 0% | 0% | |
| San Jose St | 0% | 0% | 0% | 0.0 | 0% | 0% | |
| Miss Val St | 0% | 0% | 0% | 0.0 | 0% | 0% | |
| Chicago St | 0% | 0% | 0% | 0.0 | 0% | 0% | |
| Bellarmine | 0% | 0% | 0% | 0.0 | 0% | 0% | |
| Oklahoma St | 0% | 0% | 0% | 0.0 | 0% | 0% | |
| Dixie State | 0% | 0% | 0% | 0.0 | 0% | 0% | |
| N Alabama | 0% | 0% | 0% | 0.0 | 0% | 0% | |
| Cal Baptist | 0% | 0% | 0% | 0.0 | 0% | 0% | |
| Tarleton State | 0% | 0% | 0% | 0.0 | 0% | 0% | |
| St. Thomas (MN) | 0% | 0% | 0% | 0.0 | 0% | 0% | |
| UC San Diego | 0% | 0% | 0% | 0.0 | 0% | 0% |
NFL PredictionsNFL TrendsNFL OddsNFL MatchupsNBA PredictionsNBA TrendsNBA OddsNBA MatchupsMLB PredictionsMLB TrendsMLB OddsMLB MatchupsNCAAF PredictionsNCAAF TrendsNCF OddsNCAAF MatchupsNCAAB PredictionsNCAAB TrendsNCB OddsNCAAB Matchups A product ofTeamRankings BlogAboutTeamJobsContact
© 2005-2024 Team Rankings, LLC. All Rights Reserved. Statistical data provided by Gracenote.
TeamRankings.com is not affiliated with the National Collegiate Athletic Association (NCAA®) or March Madness Athletic Association, neither of which has supplied, reviewed, approved or endorsed the material on this site. TeamRankings.com is solely responsible for this site but makes no guarantee about the accuracy or completeness of the information herein.
Terms of ServicePrivacy Policy